
Prometheus Metrics
Ditto exposes an endpoint at /metrics that returns data in Prometheus exposition format (aka OpenMetrics format). This data can be scraped by Prometheus to create real-time graphs of Ditto.
INFO
Prometheus was created by SoundCloud in 2012. It became so ubiquitous that OpenMetrics sought to standardize its custom data format.
Installing Prometheus
Install Prometheus from your package manager:
sudo apt install prometheussudo dnf install prometheussudo pacman -S prometheusScrape Metrics from Ditto
Now we need to configure Prometheus to scrape metrics from Ditto. Let's edit the Prometheus configuration file:
sudo nano /etc/prometheus/prometheus.ymlAdd the following job to the scrape_configs section:
scrape_configs:
  # ... other jobs
  - job_name: 'ditto'
    scrape_interval: 5s
    static_configs:
      - targets: ['localhost:4036']
Save the file and restart Prometheus:
sudo systemctl restart prometheusAccessing the Dashboard
Rather than expose Prometheus to the public internet, we can use an SSH tunnel. From your local machine, run:
ssh -L 9090:localhost:9090 user@your_server_ipThen, open your browser and navigate to http://localhost:9090.
That's it! Now try running some queries.
Add the Ditto Dashboard
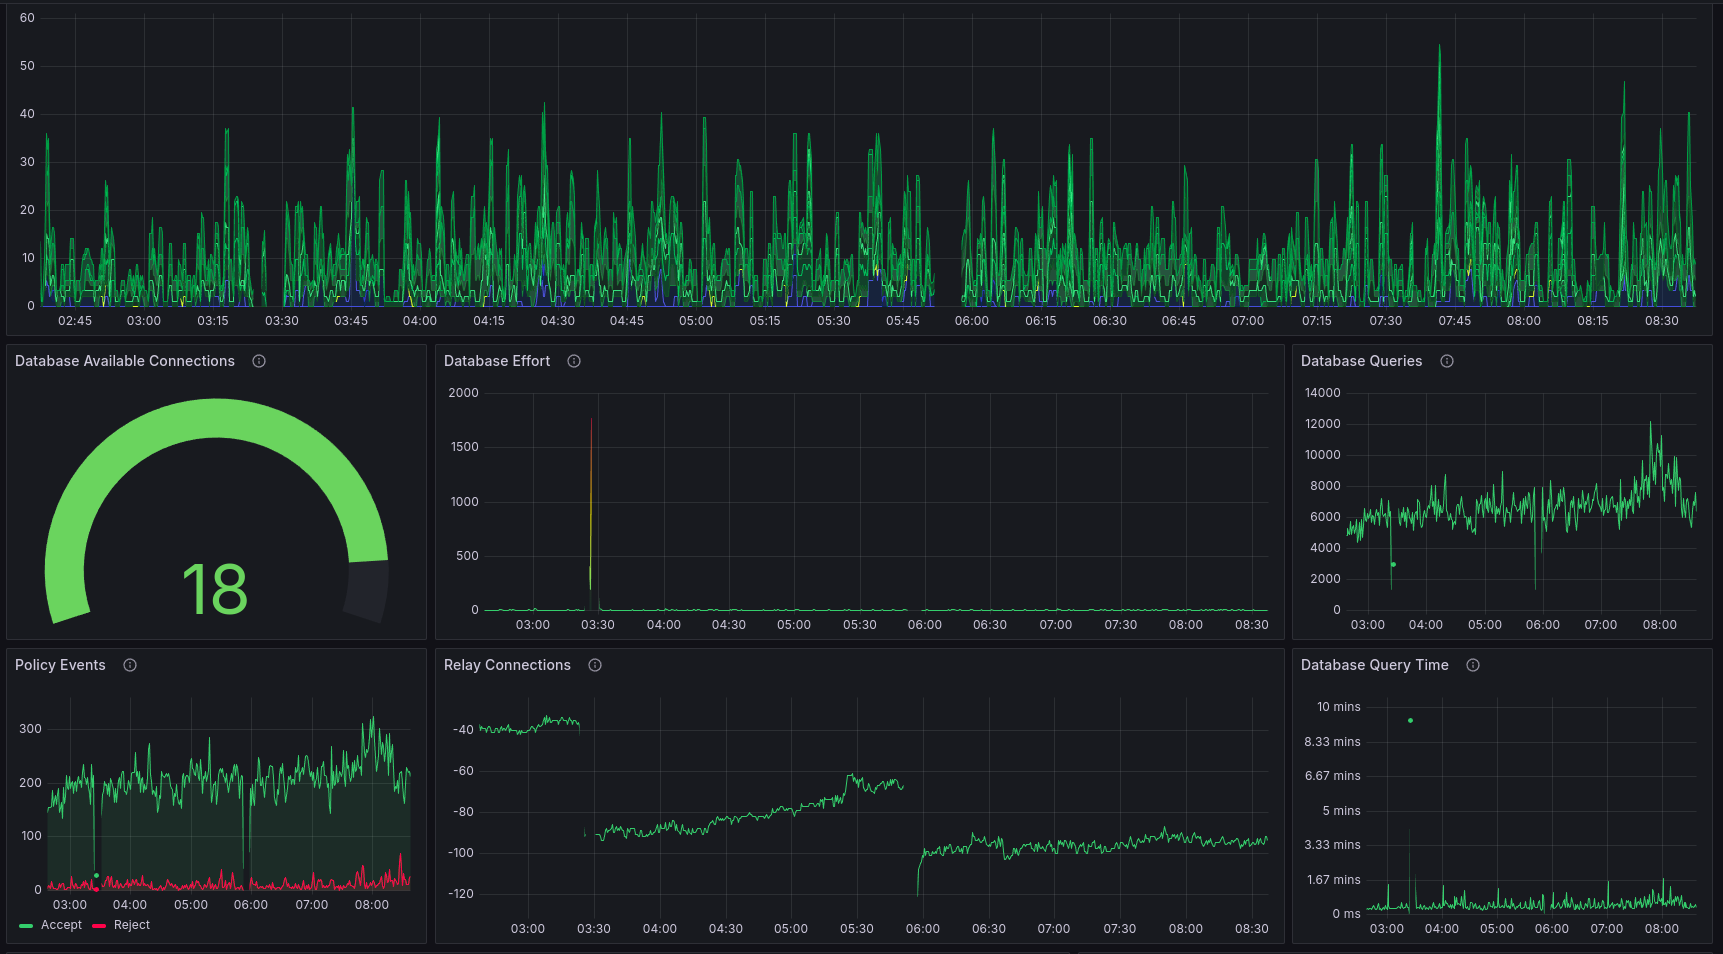
Ditto comes with a pre-configured dashboard for Grafana, located in grafana/Ditto-Dashboard.json of the respository.
In Grafana, add a new dashboard and then choose "Import". Select the JSON file and configure the data sources to use it.
Useful Queries
Here are some useful queries that you can run in Prometheus:
Available Database Connections
ditto_db_available_connectionsHTTP Error Responses by Path
rate(ditto_http_responses_total{status=~"5.."}[5m])Active Relay Connections
ditto_relay_connectionsRelay Messages by Verb
rate(ditto_relay_messages_total[5m])Relay Events by Kind
rate(ditto_relay_events_total[5m])Firehose Events by Kind
rate(ditto_firehose_events_total[5m])Database Events by Kind
rate(ditto_db_events_total[5m])Fetch Requests
rate(ditto_fetch_total[5m])HTTP Responses by Path
rate(ditto_http_responses_total[5m])HTTP Requests by Method
rate(ditto_http_requests_total[5m])